
years turning data into slides
pitch decks built on my slide structure*
I've worked both sides of the table

Natalia Korikova
Visual & Information Designer
An investor scans your deck in seconds. They are not reading every word, they are hunting for proof. If the structure forces them to dig, they move on
Investors won't spend time on walls of text when they have dozens of other decks waiting in line
Your main proof is pushed to the back behind secondary details. Most investors close the deck long before they reach it
Nobody analyzes a complex table during a quick scan. Investors miss the metric that matters and move to the next deck
Standard layouts force your metrics into generic boxes. They hide what makes your business unique and make every deck blur together
Solution: A story an investor can follow
Nothing gets invented. I take the deck you already have, work out what each slide is claiming, give that claim one object strong enough to carry it, and turn everything else down. Same content, same numbers, but read in a different order.

Fintech · Payments · Pre-seed
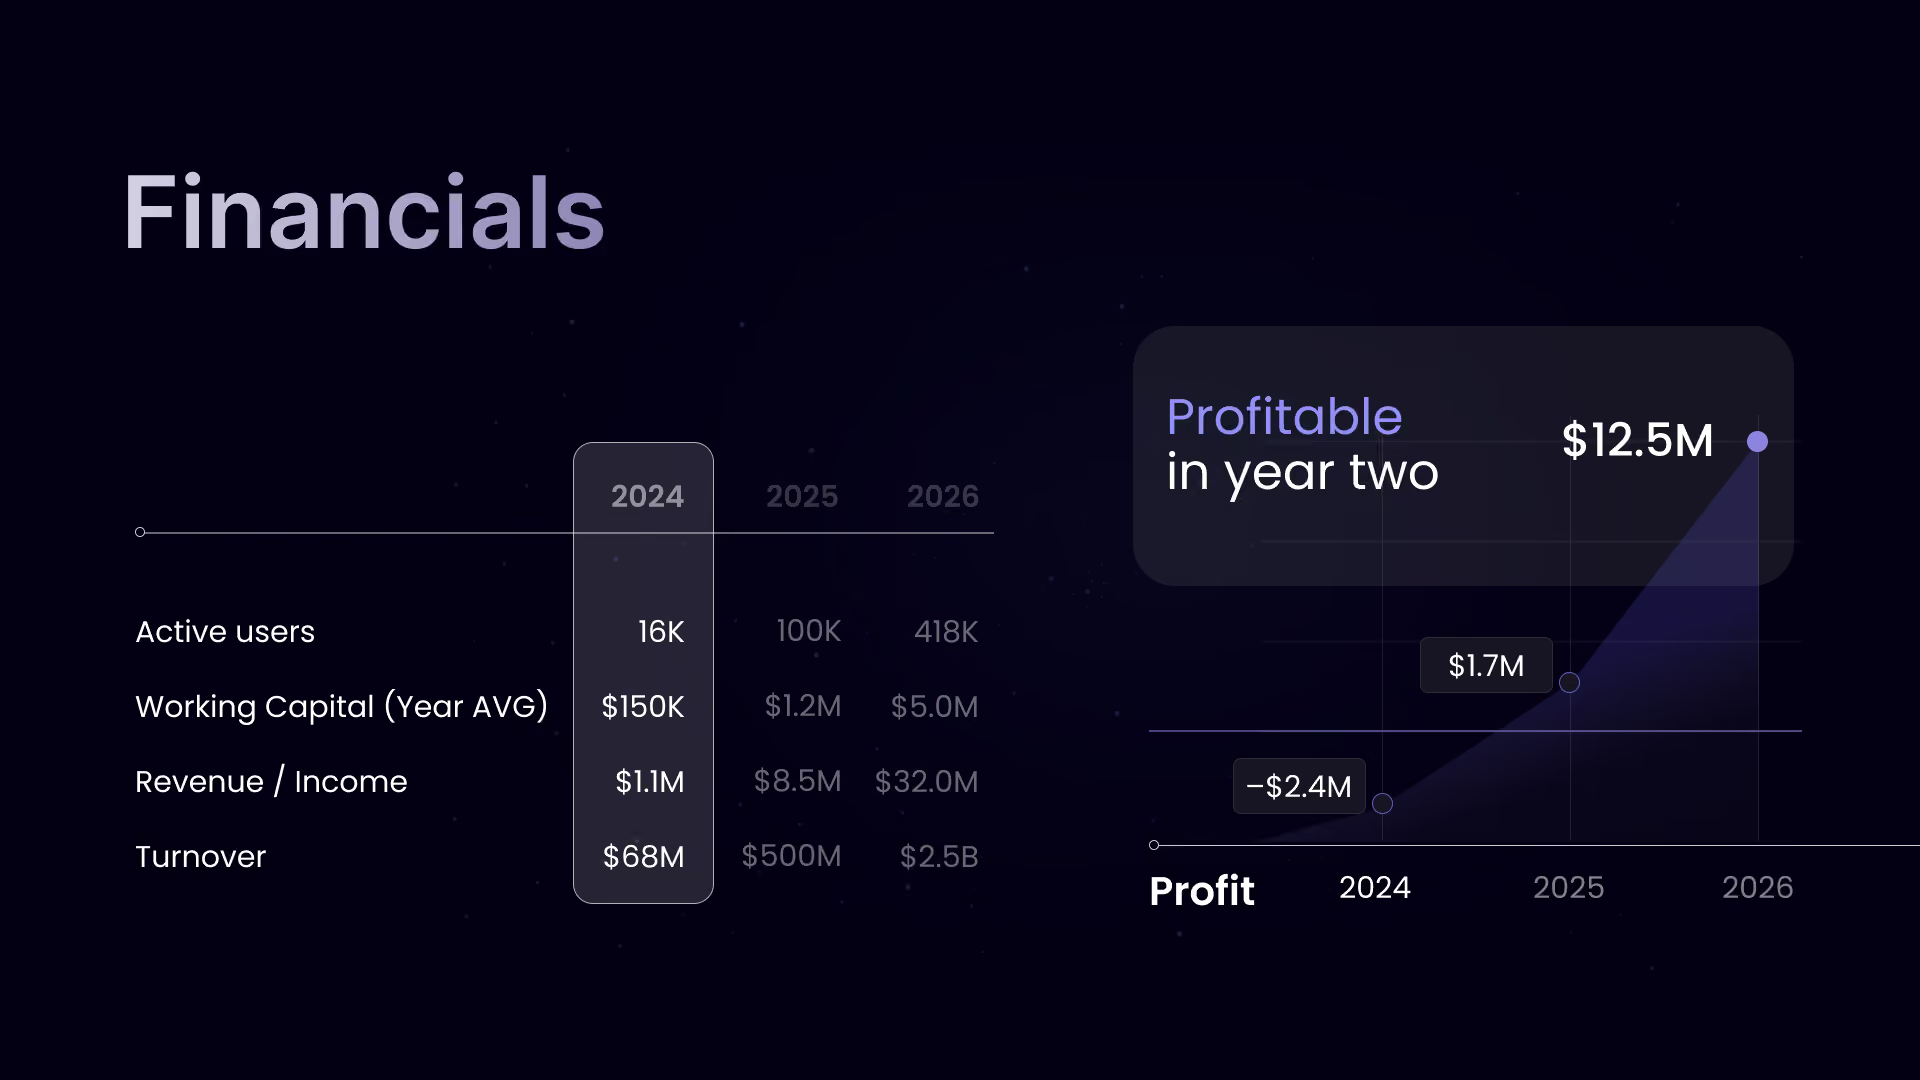
A pre-seed company with no revenue yet and a deck that had to raise money anyway. The financial slide was titled “Fin model KPI”, which was a label for a spreadsheet rather than a claim. Five rows and three columns, all the same weight, with actuals and forecast sitting in the same table with nothing to separate them. The one number the whole slide existed for, which was the year the company turns a profit, was on the last line in the same size as headcount.
Gave the slide back its standard name, so an investor knows where they are in the deck, and put the argument in a callout above the table: profitable in year two. Separated what has happened from what is projected, so the forecast reads as a forecast and the claim stays credible. Reordered the rows so money leads and cost drivers support. Built the profit curve as a chart, because a turning point is a shape, not a row of digits.
An early-stage deck with no traction to show now argues from the quality of its own assumptions rather than apologising for missing numbers. Three tables became three claims, and the funding ask and the forecast finally tell the same story.
Deck rebuild. Client’s original as the starting point · figures changed



Every figure you see has been changed. Real numbers stay with the client, and that rule has no exceptions, including for my own portfolio.
See all casesHow it Works
Priced separately, quoted per project. Compresses the process into one feedback round and pushes other projects down the queue. These are the projects I like most.
Prices
Added to any tier, agreed before we start.
+€500
Need the copy fixed too? I restructure the order and rewrite every slide headline.
€50–70 each
Bring me the messiest spreadsheet you have. Forty rows, three tabs, numbers that contradict each other: that is the exact part I want.
From 48 hours
Quoted per project. Tell me the date and I'll tell you the number.
What's not included
I visualise the numbers you give me. I don't build the model behind them.
FAQ
No hidden clauses or vague steps. Here is exactly how the engagement works.
Contact form
