Each case below shows several slides from a real deck: what was there before, what changed, and why.
Fintech · Payments · Pre-seed
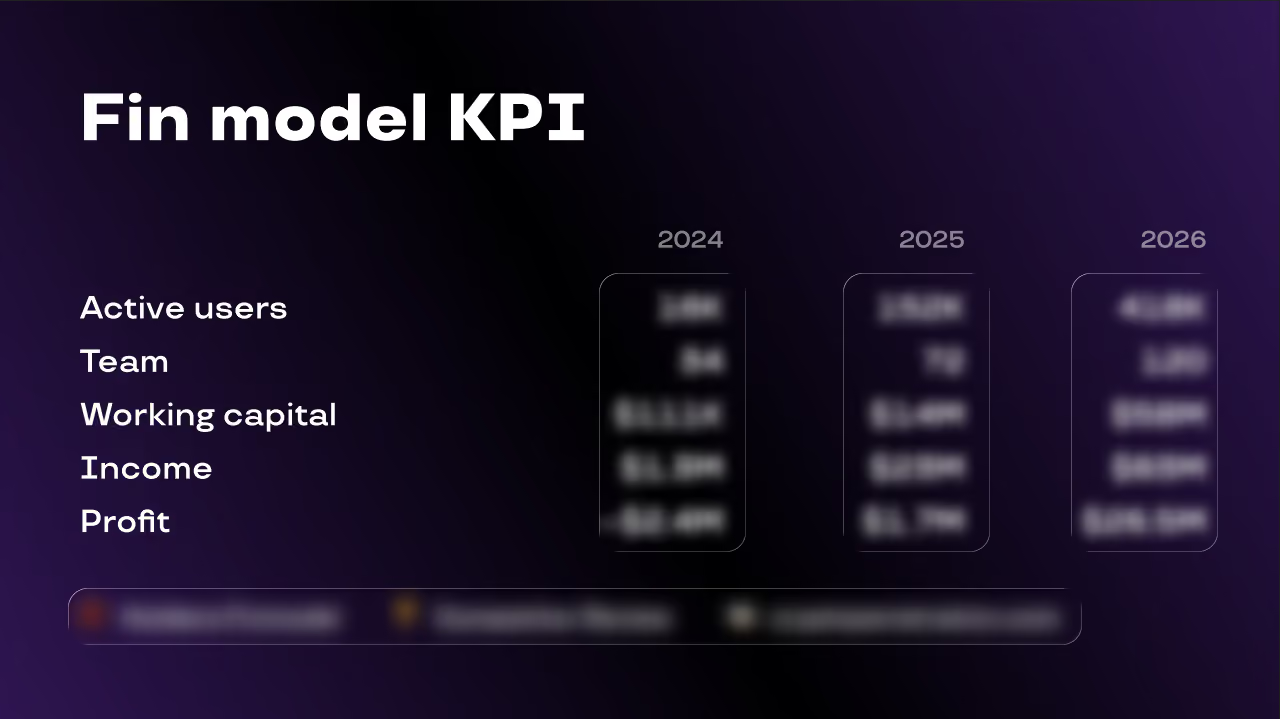
A pre-seed company with no revenue yet and a deck that had to raise money anyway. The financial slide was titled “Fin model KPI”, which was a label for a spreadsheet rather than a claim. Five rows and three columns, all the same weight, with actuals and forecast sitting in the same table with nothing to separate them. The one number the whole slide existed for, which was the year the company turns a profit, was on the last line in the same size as headcount.
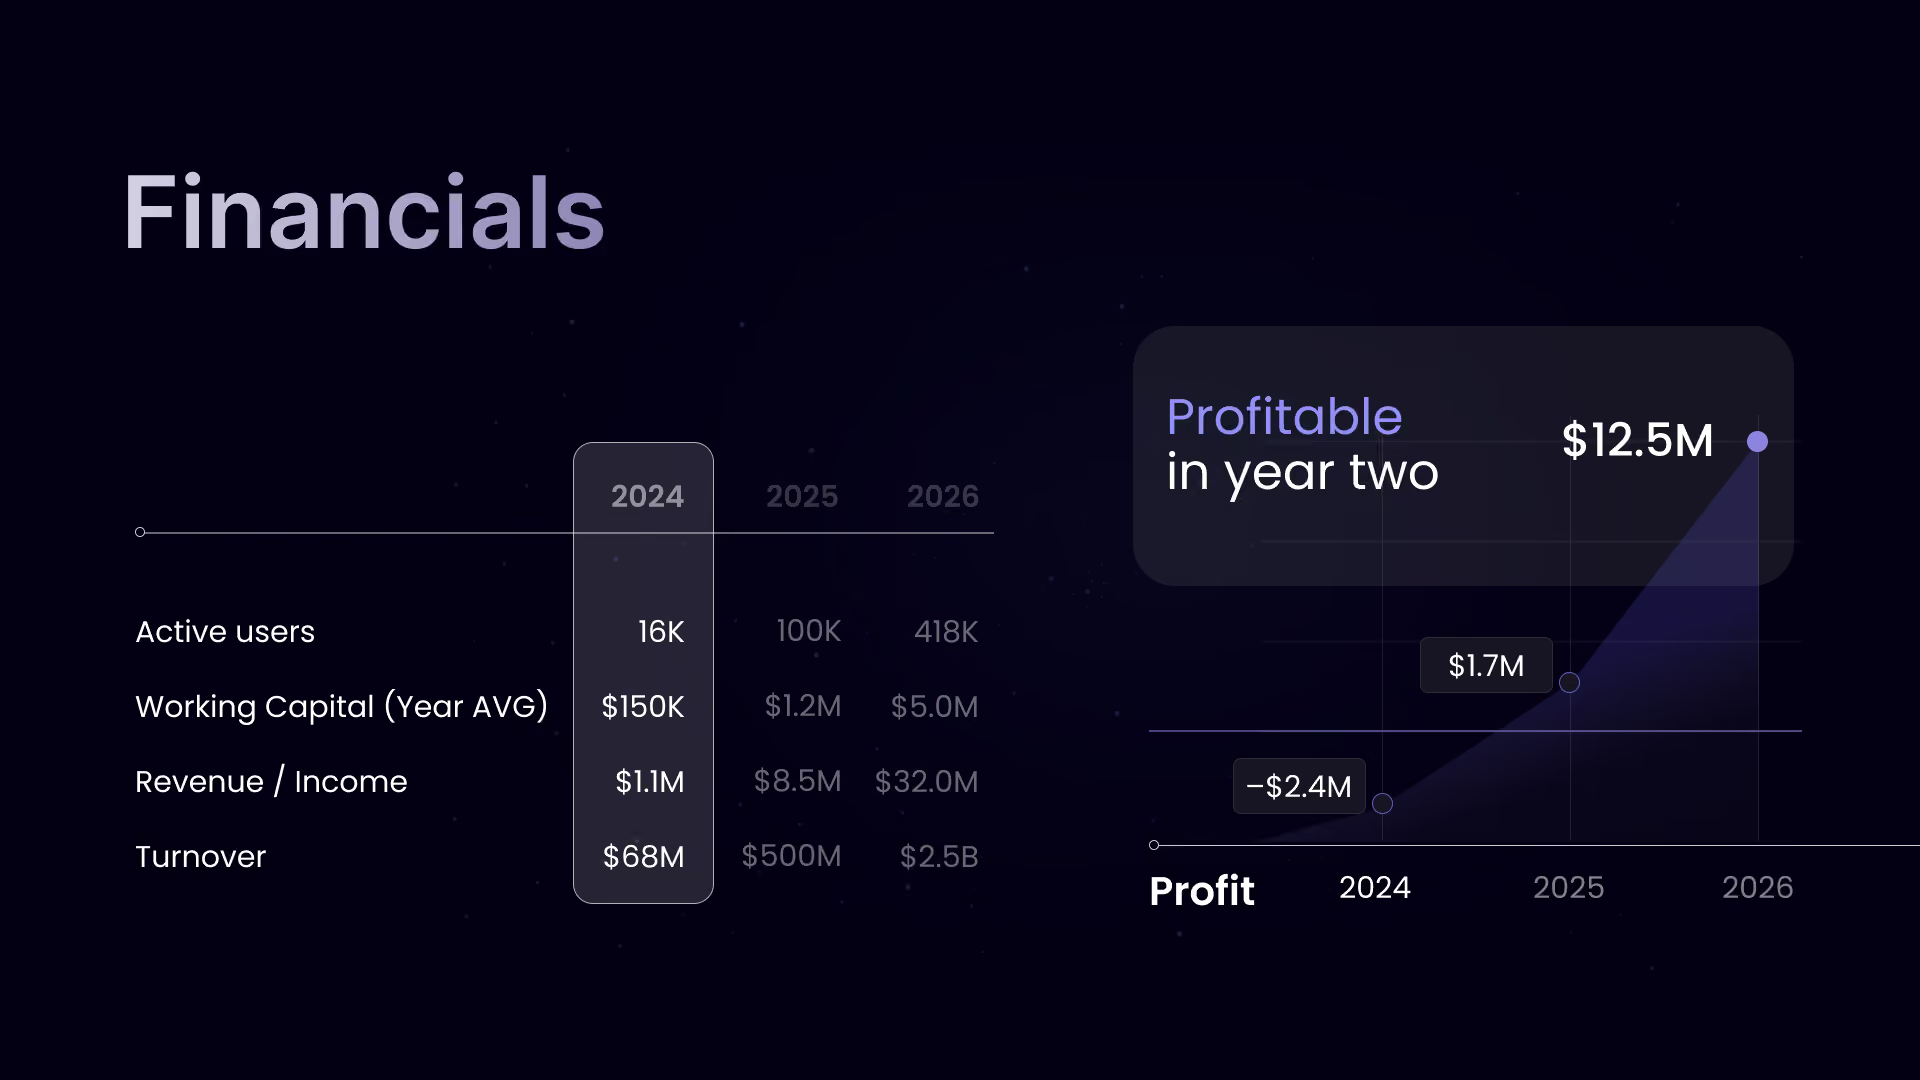
Gave the slide back its standard name, so an investor knows where they are in the deck, and put the argument in a callout above the table: profitable in year two. Separated what has happened from what is projected, so the forecast reads as a forecast and the claim stays credible. Reordered the rows so money leads and cost drivers support. Built the profit curve as a chart, because a turning point is a shape, not a row of digits.
An early-stage deck with no traction to show now argues from the quality of its own assumptions rather than apologising for missing numbers. Three tables became three claims, and the funding ask and the forecast finally tell the same story.
Client anonymised. Ticker and figures changed

Blockchain gaming · Pre-seed
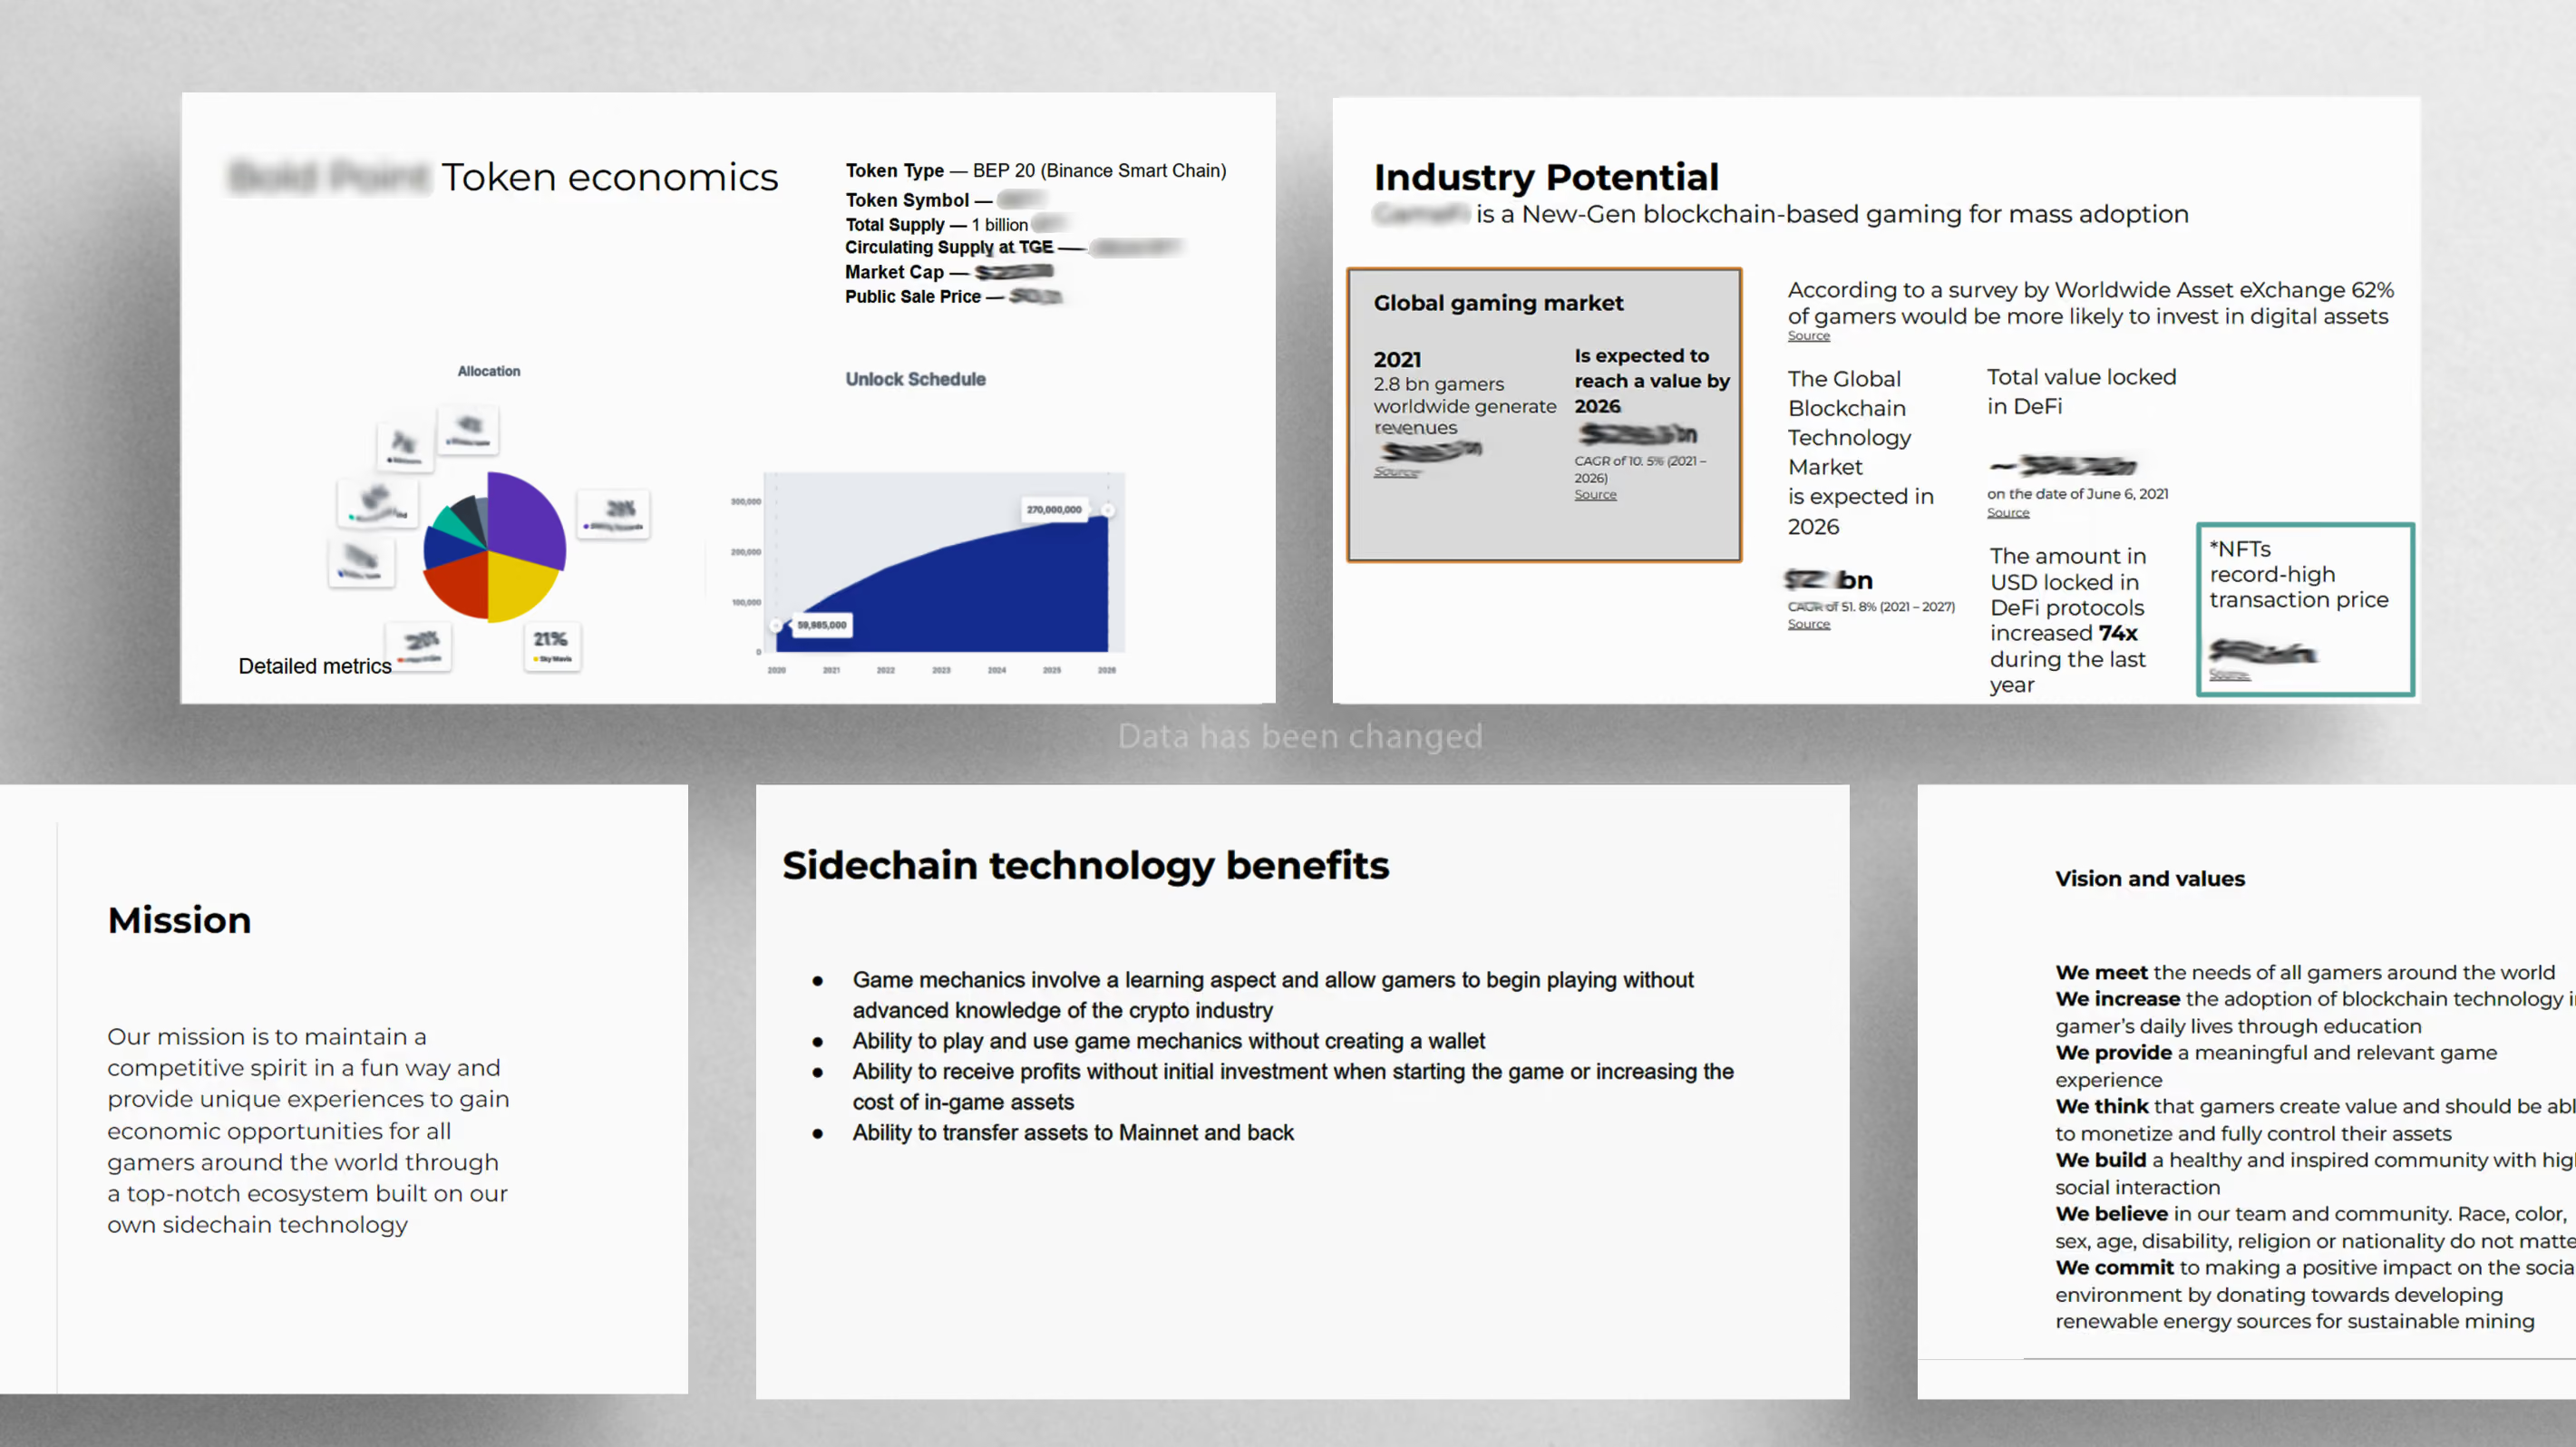
Six blocks of text in columns. Every element the same weight. Nothing on the slide told you where to look first.
Pulled the numbers out of the paragraphs and made them objects. One hierarchy per slide: one thing large, everything else in support.
Average 38 words per slide, down from 140. Three charts replaced two tables.
Client anonymised. Ticker and figures changed
AgTech · Series A
Client anonymised. Ticker and figures changed

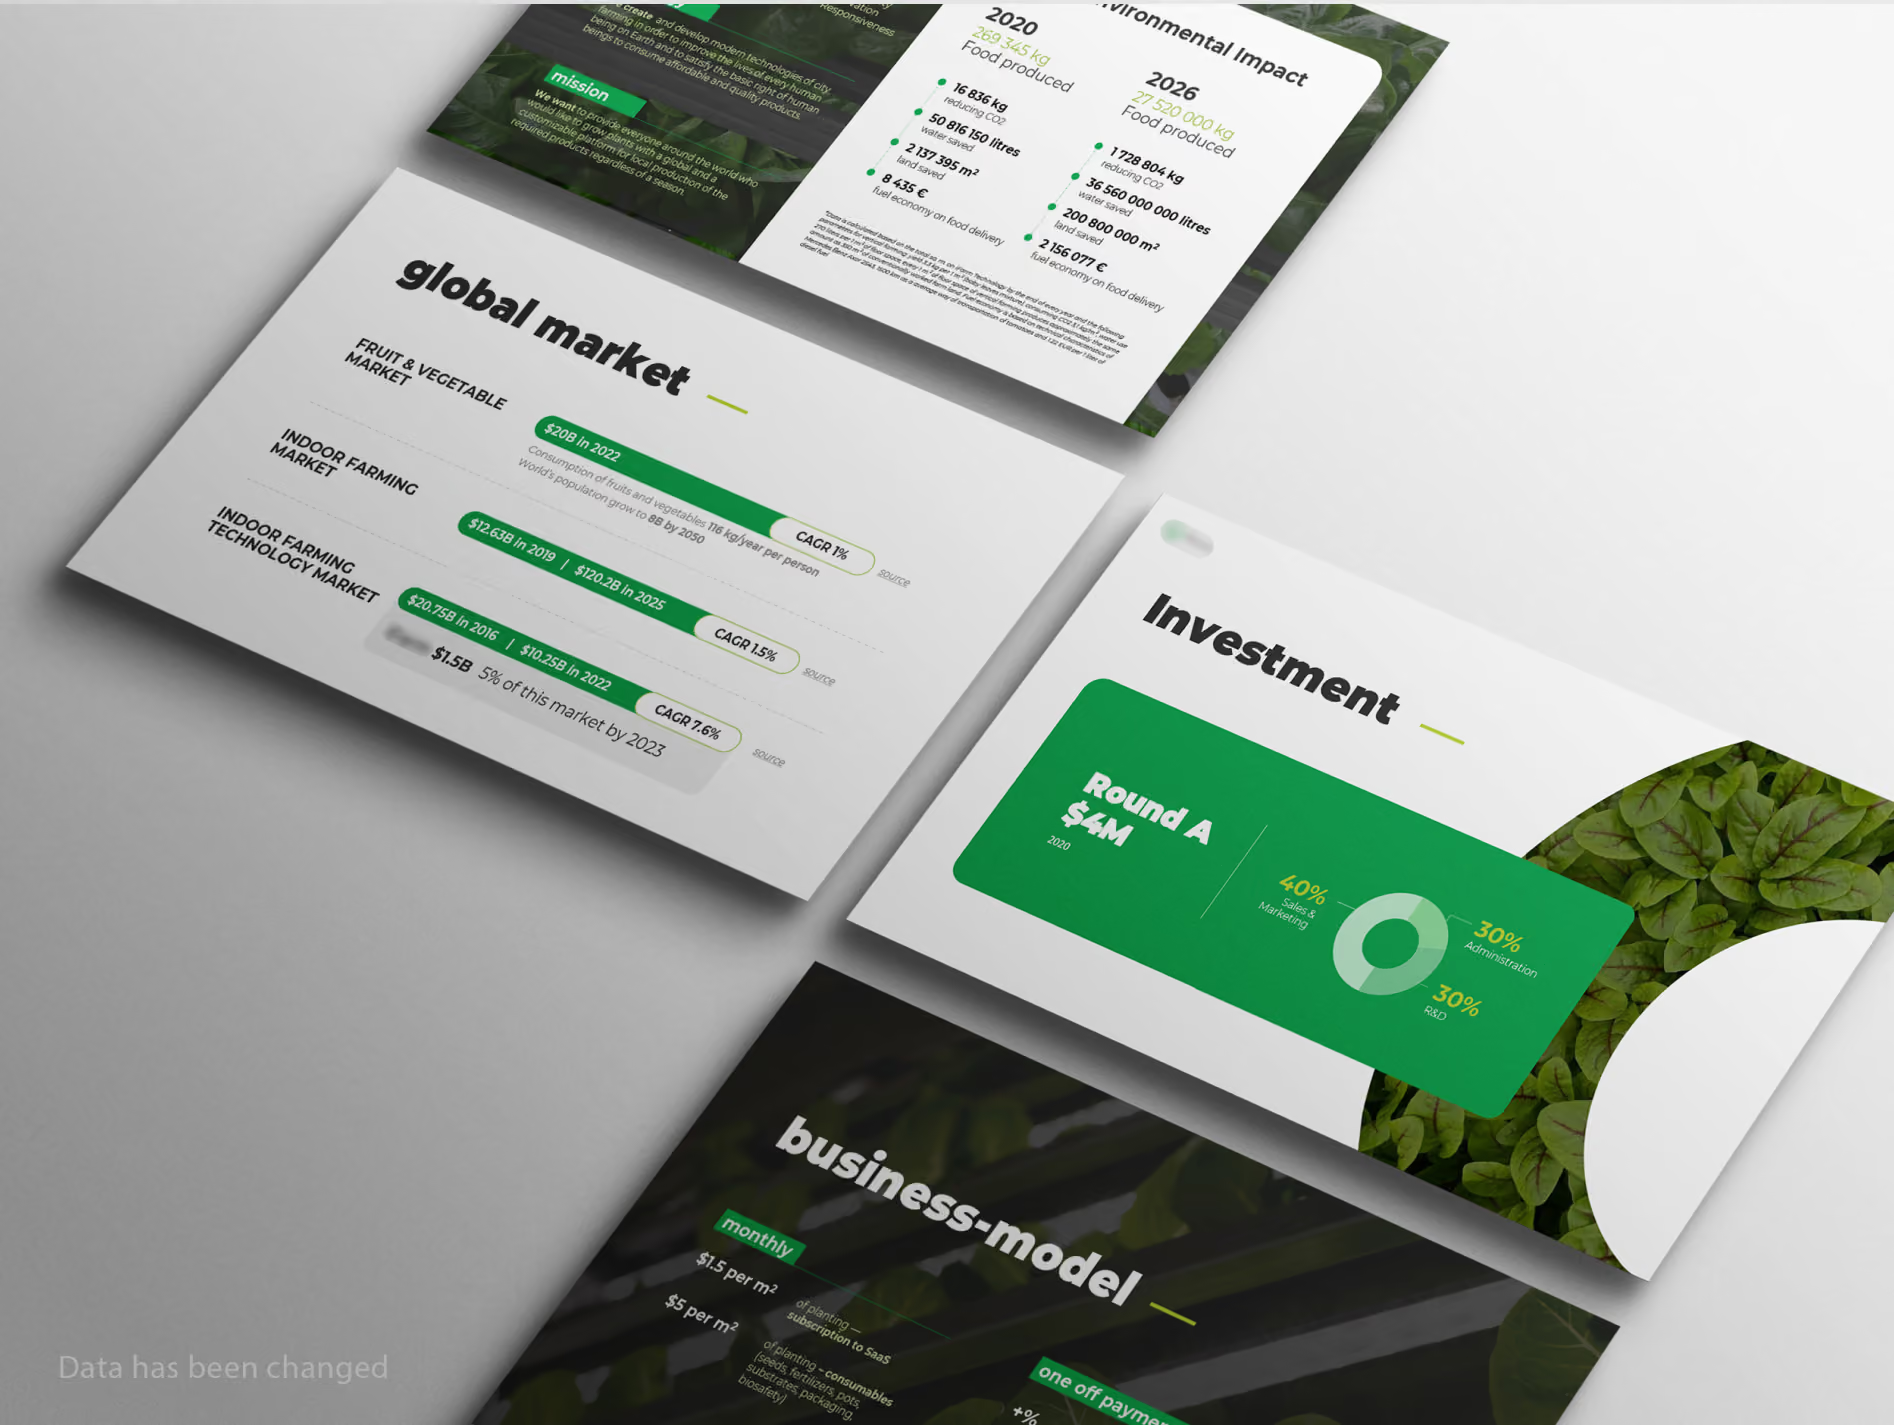
The objective was to prepare a persuasive deck for a Series A raise given the high data density. Slide overload reduced reading speed and required increased attention from investors reviewing the materials, complicating the defense of key arguments.
Transformed the presentation of market data: instead of the standard circular TAM/SAM/SOM diagram, a vertical hierarchical structure was developed. This allowed integrating supporting metrics (market size, CAGR, growth drivers, and target market share with its projected valuation) directly into the slide's structure. Data-heavy blocks on technology impact were reworked into a comparative 2020 vs 2026 matrix, clearly isolating achieved results from future projections.
The deck's information architecture accelerated slide comprehension. Key metrics are isolated and structured, ensuring a consistent narrative flow. While maintaining a high volume of textual information, the data presentation is logically structured, providing the clarity necessary for an investment decision and contributing to the closing of the round.


Mental health · Marketplace
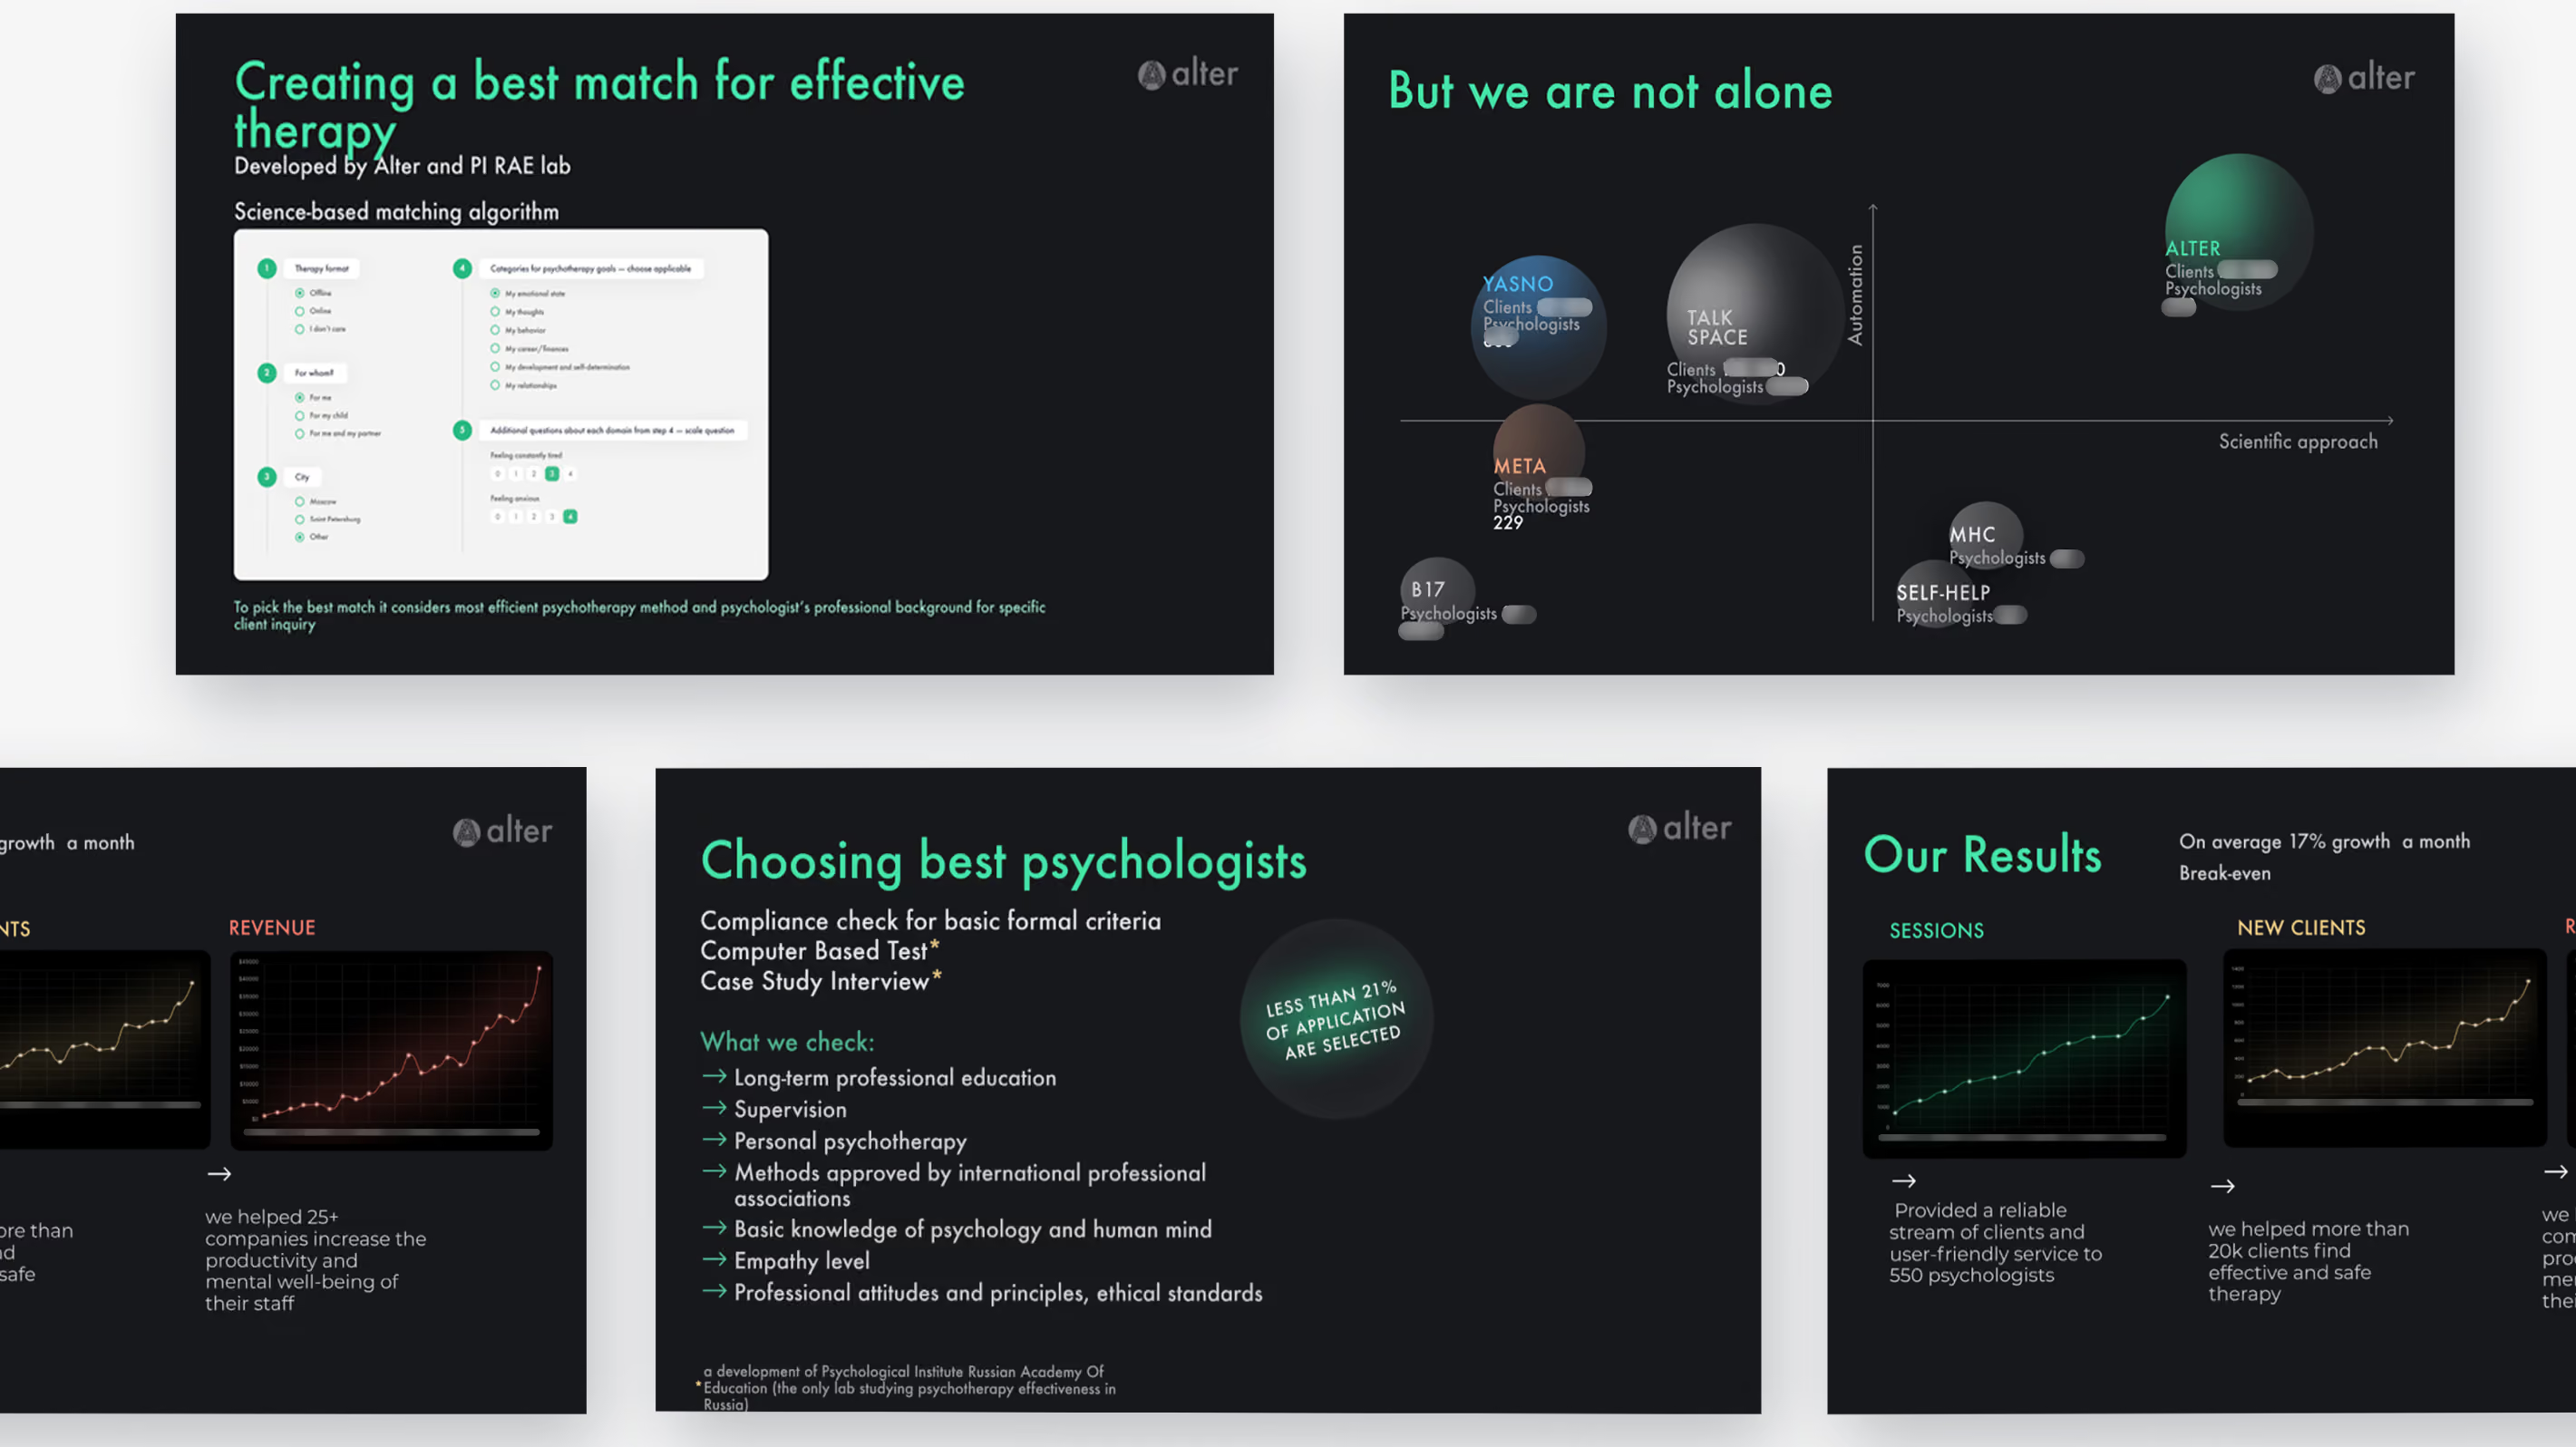
The deck was prepared for an industry award. A dark theme printed poorly and obscured core metrics. Three charts competed on a single slide, creating visual noise for the judges.
The client asked to keep the validated structure. The goal was purely presentability. We preserved the logic, overhauling only the visuals: moved to a light theme, separated the three competing charts into distinct slides, and gave the main comparison the full width it required.
Same content, radically better readability. Every metric is clear without zooming. The deck now looks as strong as the project itself and is ready to compete.
Alter · Competitor figures removed


Fintech · Payments · Seed
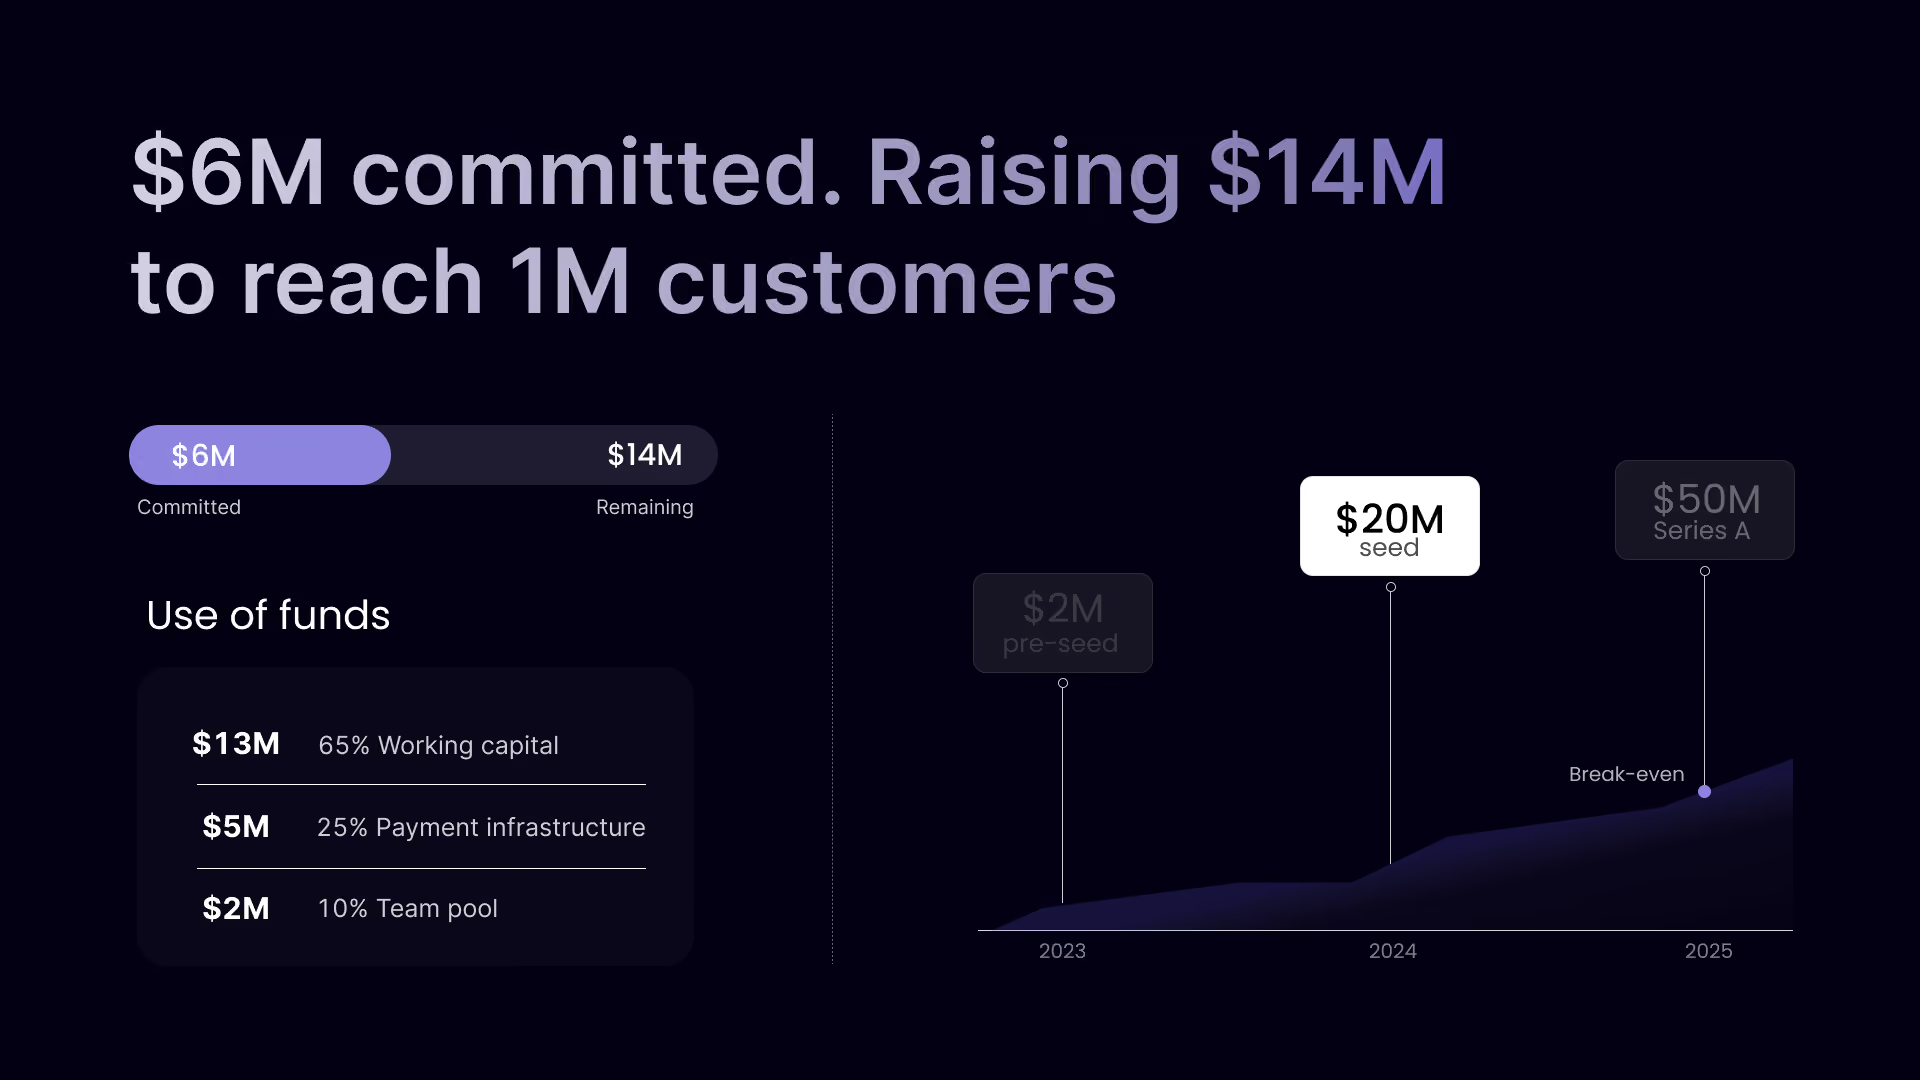
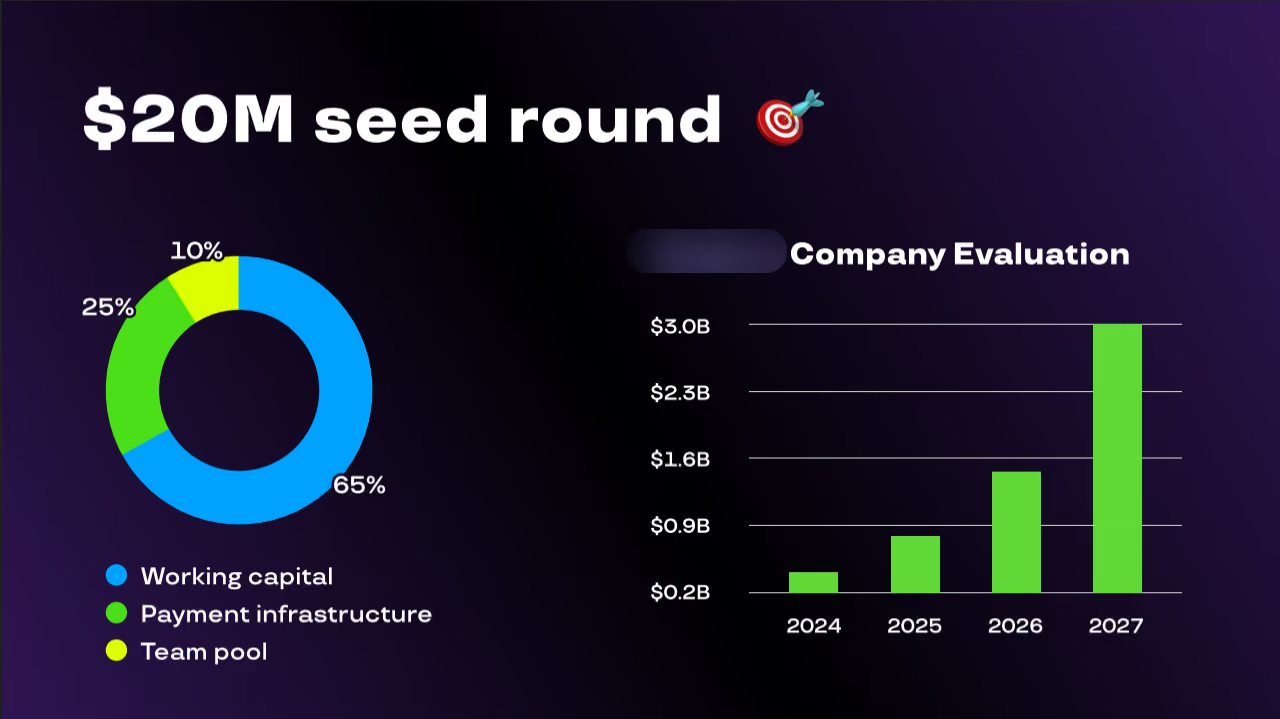
The slide doesn’t fulfill its function — it doesn’t justify the investment offer. Instead of making the case for the $20M ask and showing current progress, the focus is on a valuation forecast of $3B by 2027. The investor sees no justification for the amount, no current status of the deal, and no growth plan. The slide showcases a future valuation while bypassing the current round.
Rewrote the headline to reflect reality: “$6M committed. Raising $14M to reach 1M customers.” Replaced the pie chart with a transparent “Use of funds” block with specific amounts that add up to the total round size. Instead of a speculative valuation graph, built a strategic timeline showing the company’s path from pre-seed to the current seed round and on to Series A. Shifted the focus from an abstract future valuation to the current round and the key milestone — reaching 1M customers.
The slide became focused and clear. It now immediately answers the investor’s main questions: how much has already been raised, how much is left, and what exactly the funds will be used for. Replacing the valuation forecast with a development roadmap made the ask more justified and logical. The slide now withstands the first 30 seconds of a pitch without extra questions — the dialogue with funds centers on growth strategy, not on clarifying numbers.
Client anonymised. Ticker and figures changed
years turning data into slides
pitch decks built on my slide structure*
I've worked both sides of the table

Contact form